
Google Classroom: Add a Feature

Google Classroom is a Learning Management System (LMS). We added an analytics tab to help educators view and analyze data on students’ engagement and approach to learning.
Project Details
Role:
1 month

Timeline:
Product Designer
Tools:
Figma
Key Features
Analytics Tab
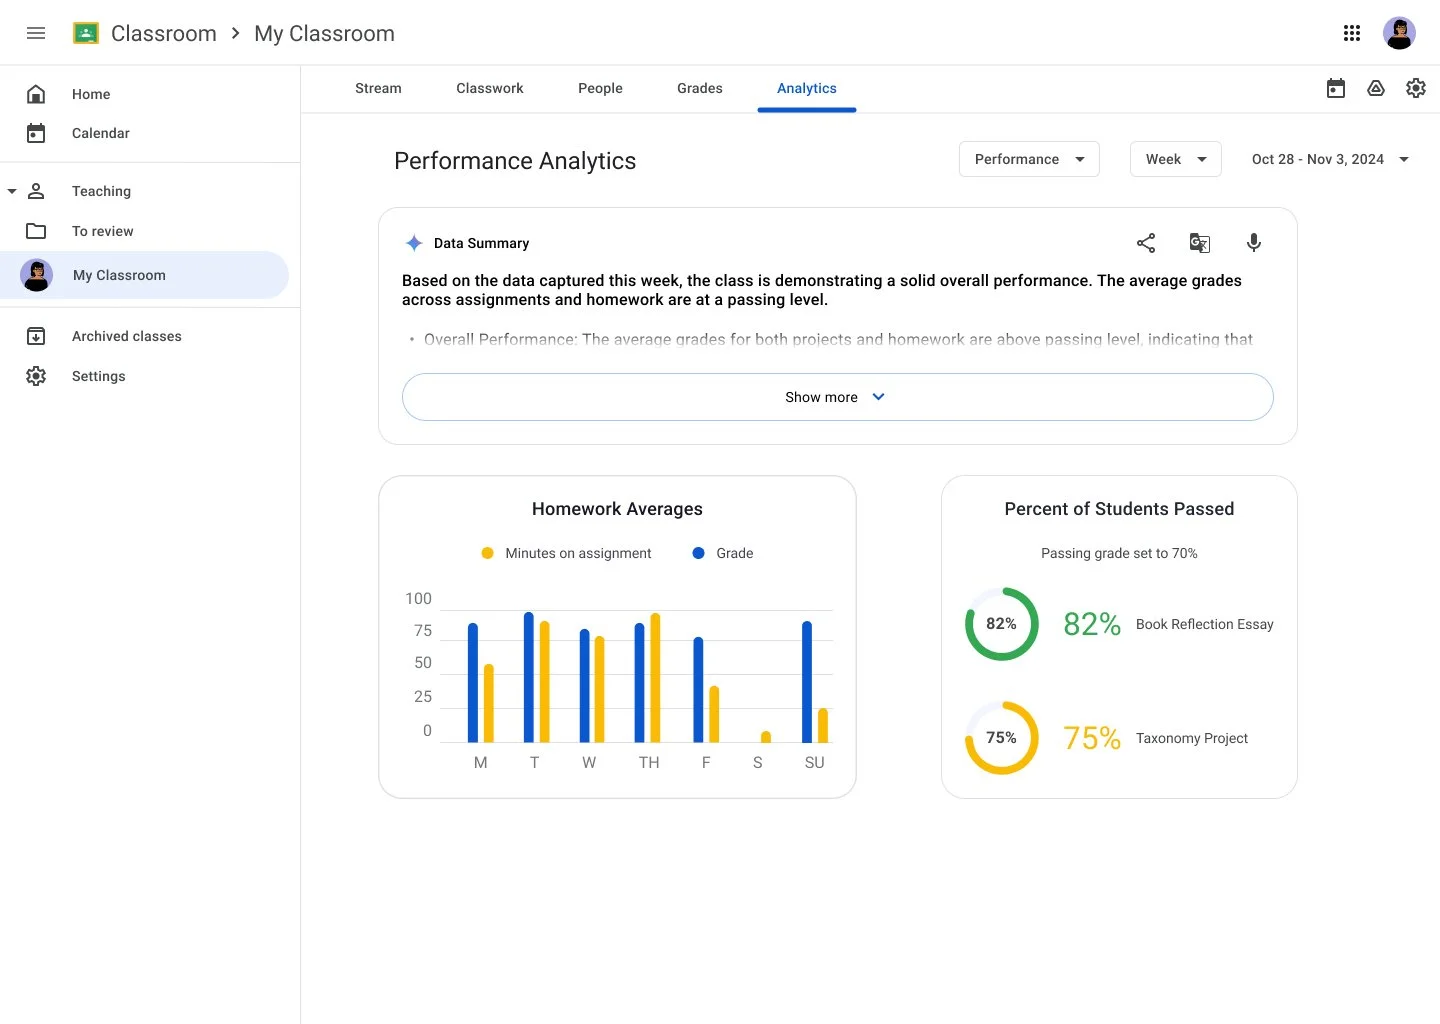
The Analytics tab was added to Google Classroom to give educators quick access to a range of student data. The primary feature depicts student engagement data to provide teachers with insights on the ways their students are approaching learning.
One of the primary responsibilities of an educators is tracking and measuring student learning. This daily task is difficult with limited time and resources. We implemented a data summary from generative ai to provide educators with the snapshot insights and recommendations they need to support student progress.
AI: Data Summaries
Consistent Navigation
The breadcrumb navigation and filtering options are designed to help educators locate the student data types and time spans they need with ease. These navigation patterns are aligned with Google Workspace’s systems.
1.
Empathize
Background
The core focus of measuring student success with standardized testing and assessments in on the decline in current years. For example, the November, 2024 ballot in Massachusetts asked voters to decide if the state standardized test, MCAS, should continue to be a requirement for high school graduation. These questions are becoming the focal point of educational discourse, as the importance of student’s learning behaviors and patterns become an increasingly prevalent method of assessment for learning progress and goals. The way teachers are cultivating learning in their classrooms is changing to highlight students’ approach to learning. We want to integrate this approach into Google Classroom.
At large, EdTech platforms are designed as Learning Management Systems (LMS) to help educators plan, deliver and track lessons. Google Classroom, in particular has become an industry standard. Currently, Google Classroom supports only summative assessments to track student progress: by logging assignments completed and providing a grade book to educators. This case study aimed to integrate a feature to provide an overview of student engagement and analysis on students approach to learning by monitoring their learning behavioral patterns and progress.


Research Goals
To understand classroom teachers main utilization of Google Classroom and their primary motivations.
Identify at least one pain point and area where Google Classroom does not support the progress monitoring and growth of students’ learning.
To analyze the methods teachers use to track learning and engagement of diverse learners in their classrooms, and compare these methods to features currently available in Google Classroom.
User Interviews
Interview Participants:
5 educators participated in scripted interviews that lasted between 30-40 minutes.
Participants had a wide variety of teaching experience ranging from 3 years of experience to more than 10 years.
Each educator has used Google Classroom at some point in their teaching career, but the uses and degree of use varied in application.
All of the participants are licensed teachers. For this licensure, each educator had to pass state issued tests and comply with both national and state standards.
In alignment with our research goals, we interviewed educators trained in providing accommodations and differentiated instruction for students with varying learning needs and educational plans.
Each educator has specialized training in teaching English Language Learners, through their Sheltered English Immersion (SEI) endorsement.
Interview Overview:
The interview balanced conversations about the educators’ teaching practices and goals, with conversations about their utilization of Google Classroom to support their students and classroom practices
Overall, the educators view their role as a facilitator of learning content and appropriate behaviors, an advocate for students, and an opportunity to track student growth.
The focus of the participants with mid-expert level experience was on students’ progress, engagement and learning behaviors. They expressed this as a shift in their teaching practice, and also a cultural shift in the education field in recent years.
Each educator spoke about their unique style to teaching, which they could relate to a pedagogical framework (TAB, MTSS, PBIS, SEL, etc.)

Affinity Mapping
Education is trending towards a new focus in teaching and assessing learning: metacognition. Every teacher interviewed shared that they focus on students’ approach to learning and this approach is just as important to recognize and assess, as the summative learning outcome.
Key Insight 1
Educators prioritize that the learning is accessible, fostering intrinsic motivation, and teaching independent learning techniques.
Key Insight 2
The new frontier of learning (metacognition) and daily integration of technology, has introduced pain points in tracking student growth. Educators are working to find methods for authentic assessment, and quantifying data that is typically tracked in a qualitative manner (metacognition and students’ approach to learning).
Key Insight 3
User Persona
Ms. Smith represents a mid-career Educator, who is an intermediate Google Classroom user. She is passionate about her role as a teacher, and wants to support every student in succeeding. The role of a teacher is expansive, and her time is limited– she needs to maximize her time and resources. Ms. Smith is the type of user who sees Google Classroom as a tool to differentiate instruction and support learners of varied paces. She wishes that there was an easy way to track student growth and engagement on Google Classroom, so that she could collect and assess this data for her annual Student Learning Goal with measurable outcomes.
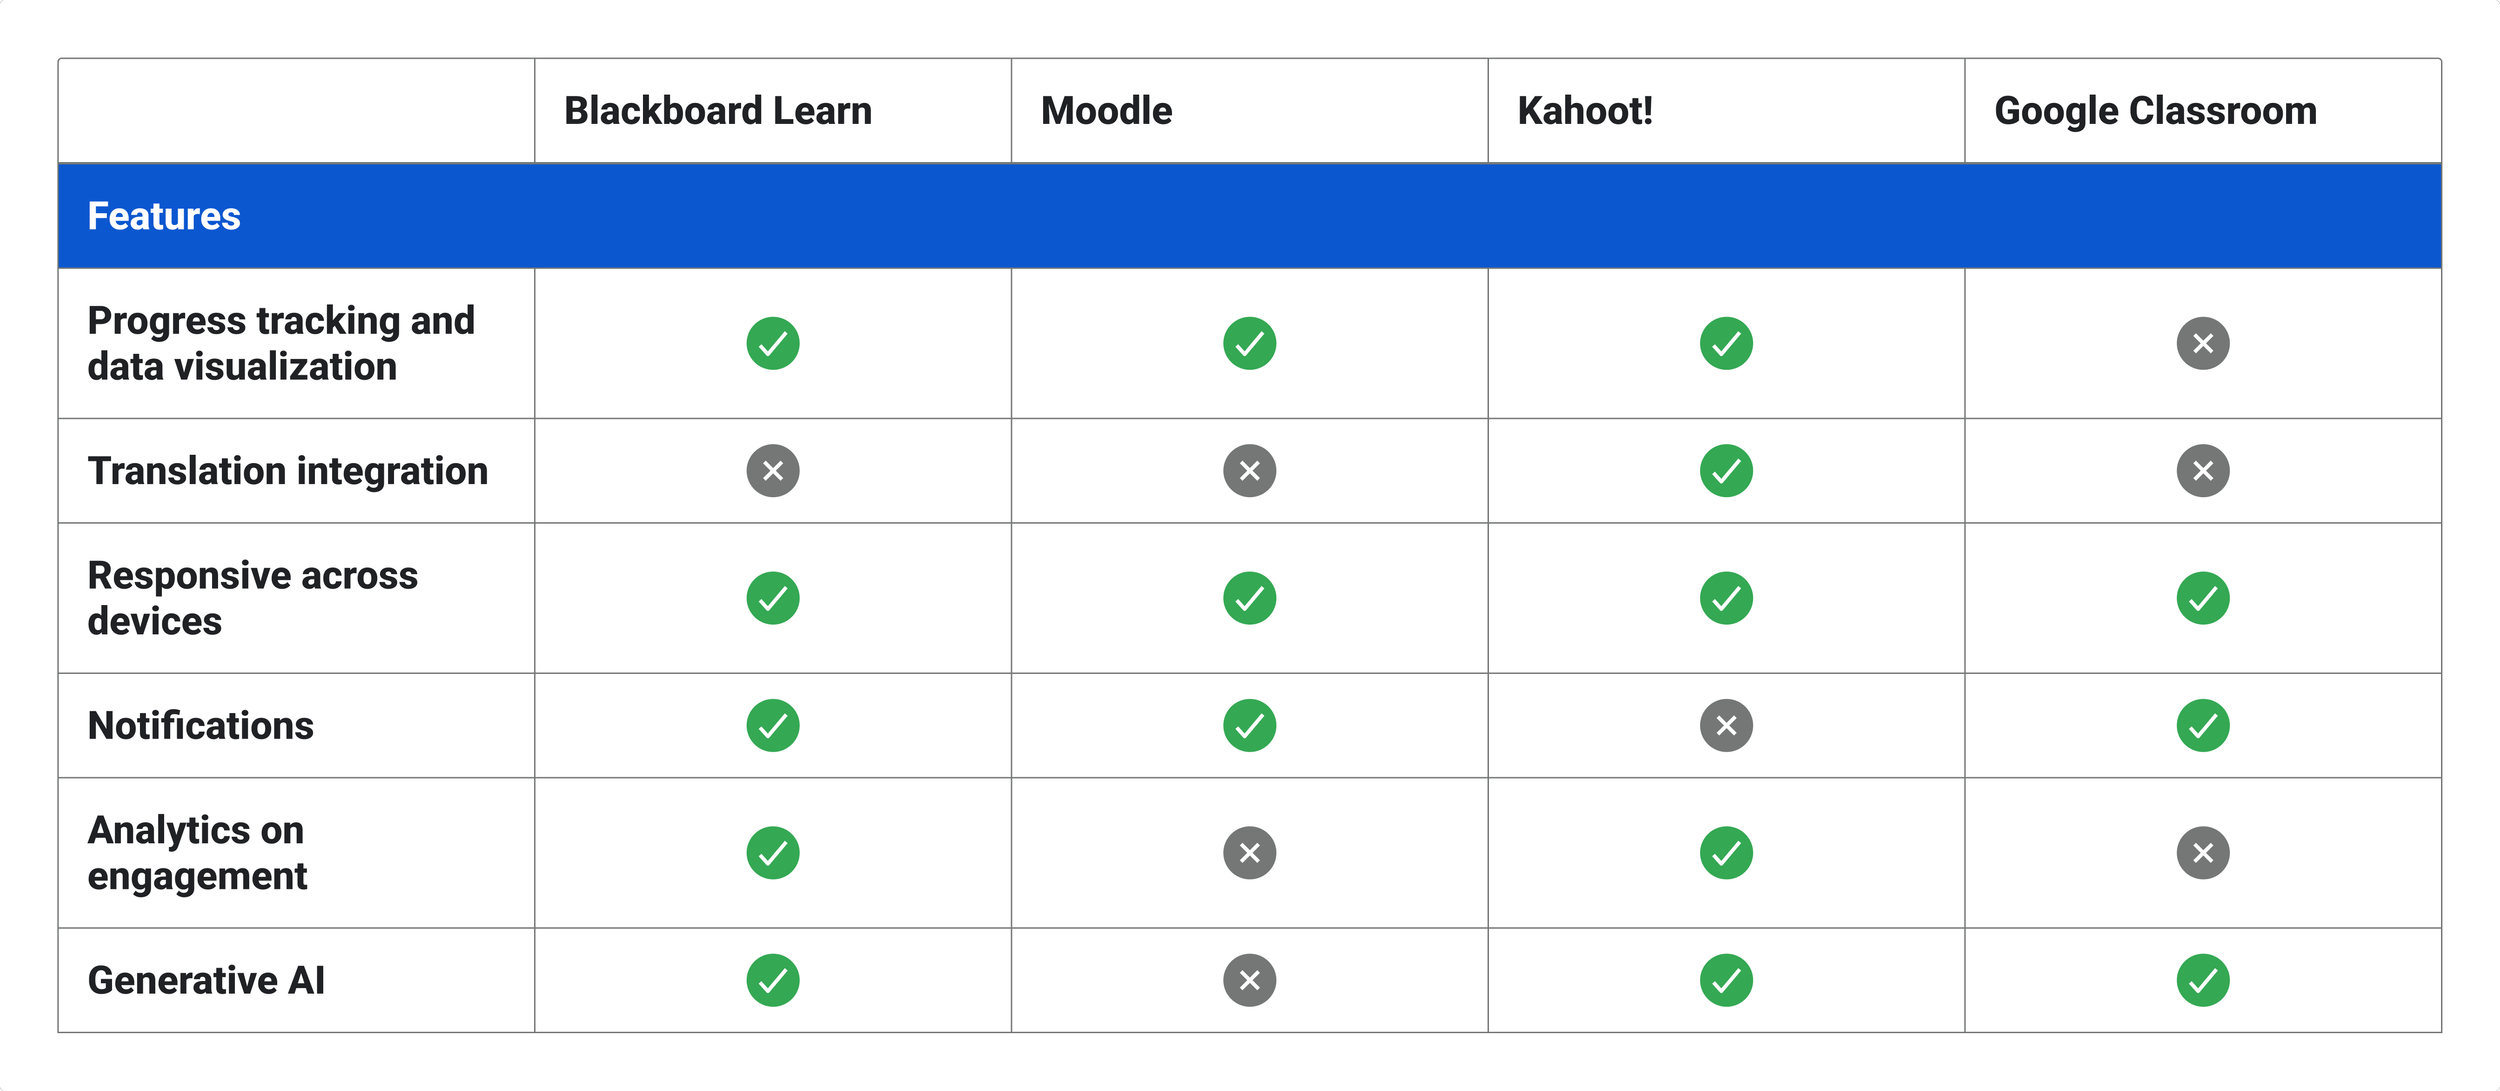
Competitor Analysis
The competitor analysis focused on the key features of learning management systems mentioned by educators in the user interviews. In addition to the feature audit visualized on the right, I conducted an in-depth competitor analysis. Select the Figma button below to view.
The Competitor Analysis prompted me to notice the opportunity to add a Google Classroom feature that captures analytics on student engagement and data visualizations on progress tracking.
2.
Define
Project Scope
This exercise and deliverable was imperative to keep the project on track. The project constraints, limited time and my role as the sole product designer, meant that a definitive project scope was essential.
Task and User Flow
The user research and project scope ultimately determined that Google Classroom educators need access to comprehensive data visualizations and summaries of student engagement.
The Task Flow: illustrates a user’s direct path to accessing student engagement data visualizations and summary.
The User Flow: depicts the potential paths a user may take to access, primarily by filtering, student engagement data.
3.
Ideate
Problem Statement
Educators are increasingly seeking a holistic view of student comprehension and learning. This holistic view needs to encompasses both formal evaluations and students learning behaviors. Google Classroom currently does not support the tracking of student engagement and learning behaviors, which are essential for educators to monitor students’ learning progress holistically. To improve educational outcomes, it is essential to explore how integrating engagement analysis features can provide educators with actionable insights and foster a more supportive learning environment tailored to individual student needs.
How Might We?
How might we increase a holistic view of students approach to learning in Google Classroom so that teachers can understand students’ learning behaviors?
How might we visualize data analytics for Google Classroom Teachers so that they can seamlessly access a comprehensive view on students’ engagement and approach to learning?
Feature Prioritization
The primary functionalities for the additional Google Classroom feature were established through an Effort vs. Impact Matrix. These features were shaped by competitive analysis but were ultimately refined by understanding the motivations and pain points of our users, as revealed through user interviews and research synthesis.
Low Fidelity Wireframes
The low fidelity wireframes focused on mapping out the new Google Classroom feature to capture student engagement data.
Important considerations were:
Storing the analytics in a tab to align with the current navigation pattern
Displaying both data visualizations and data summaries on the same screen
Providing users with filter options
High Fidelity Wireframes
The high fidelity wireframes were created with Google’s design system for a seamless implementation of the analytics feature. The wireframes guide users through the main task flow: accessing student engagement data. An additional screen, student Performance Analytics, is included to help further contextualize the range of data educators need to capture.
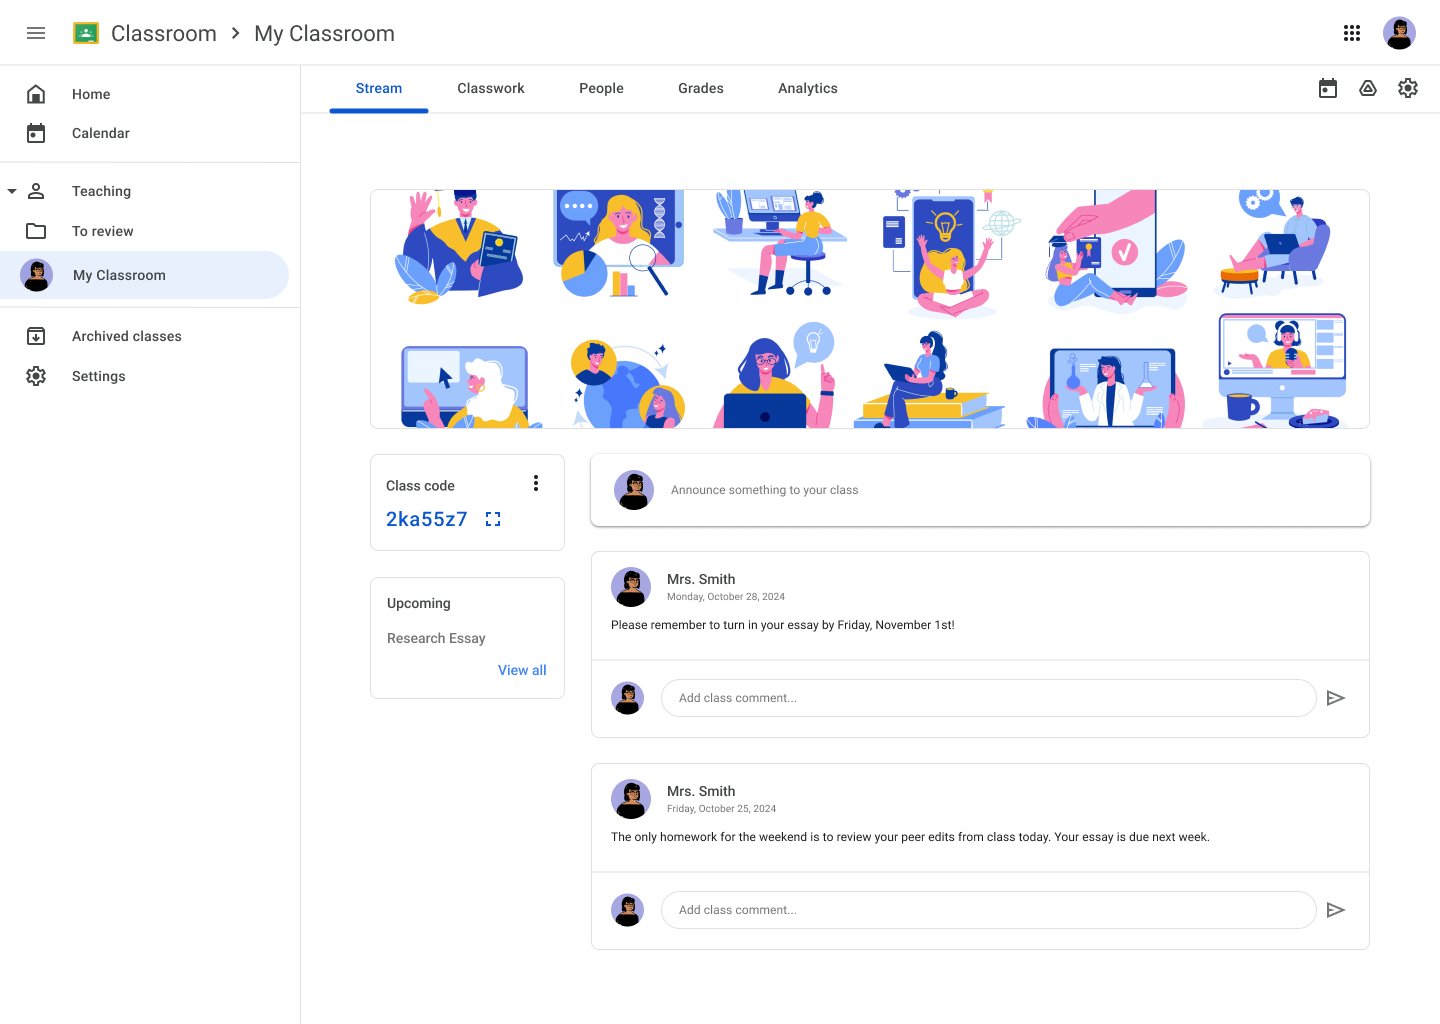
Google Classroom Stream
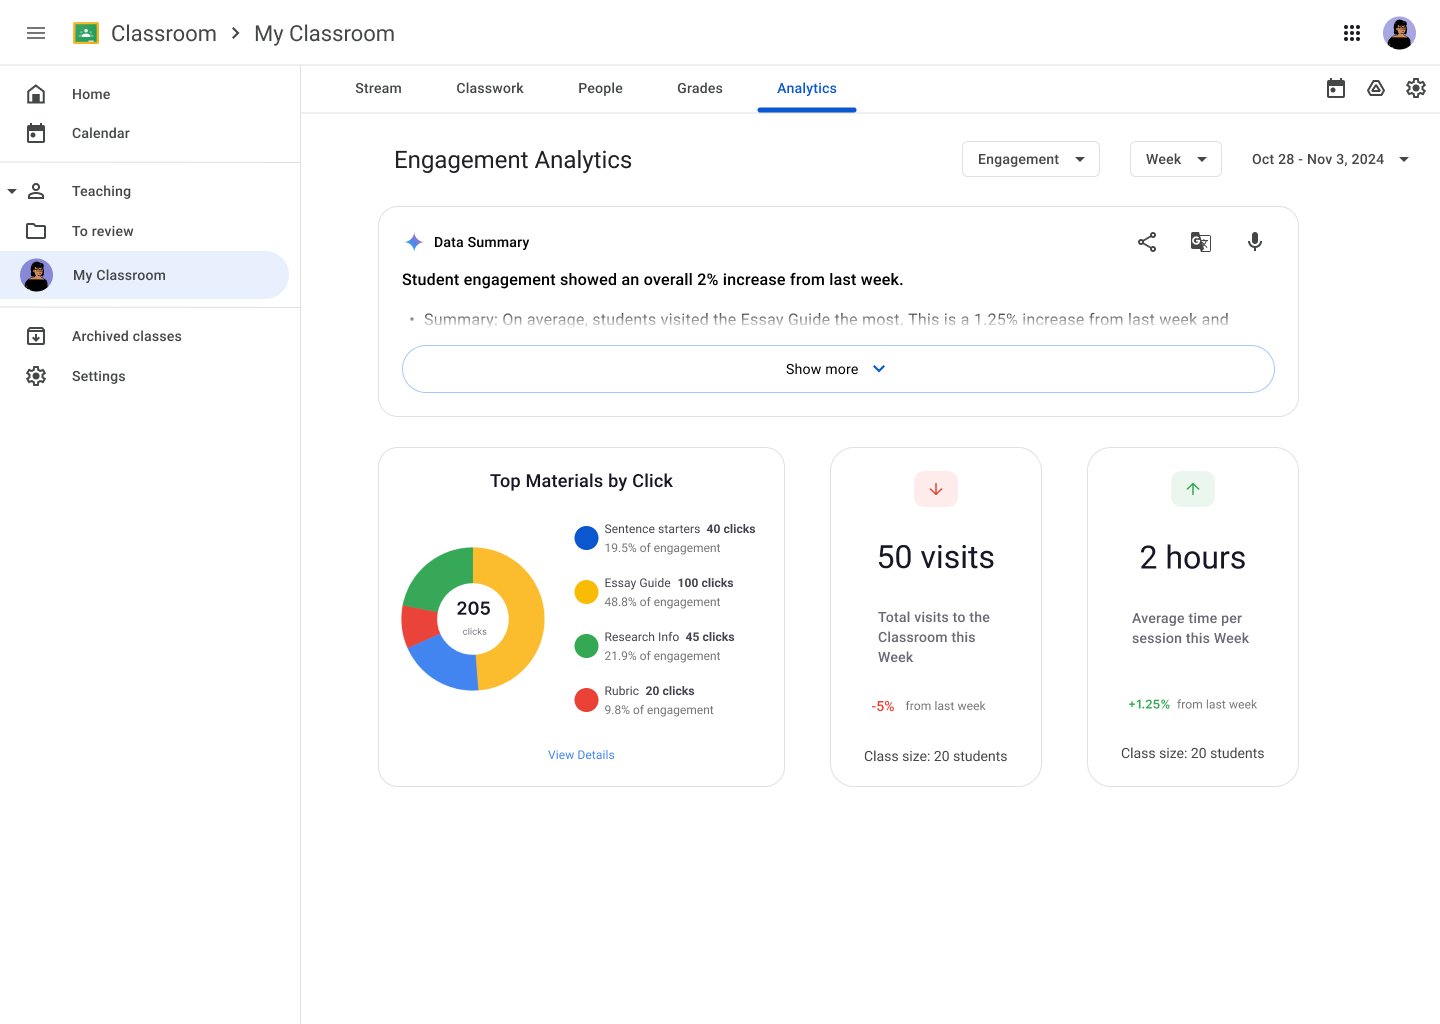
Google Classroom Enagement Analytics
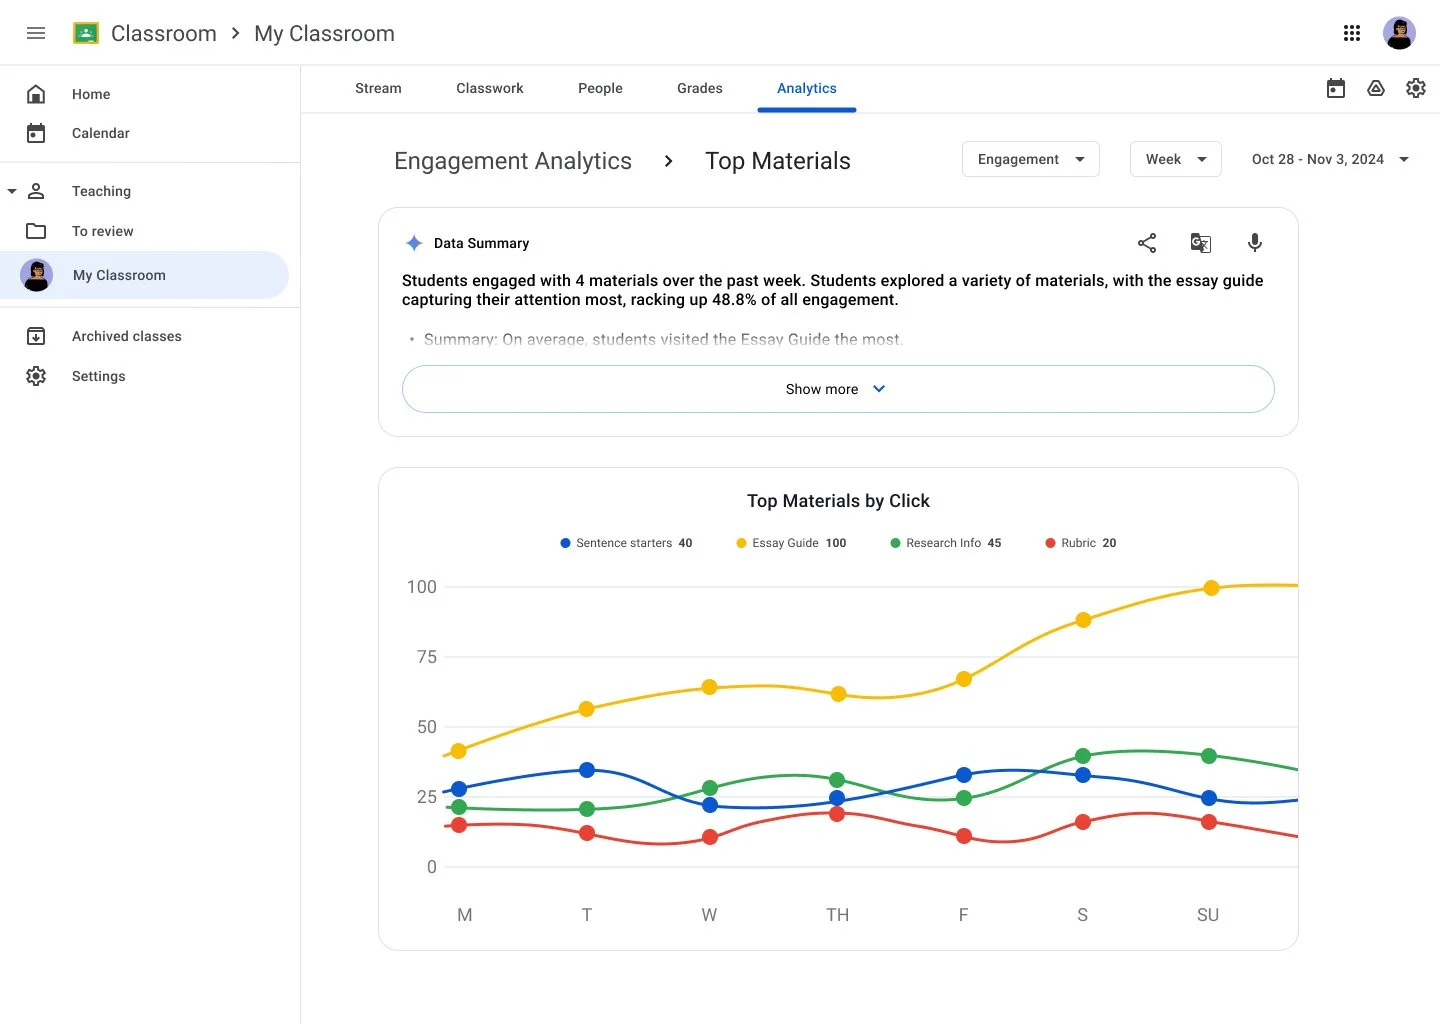
Google Classroom Top Materials
Google Classroom Performance Analystics
4.
Prototype
Prototype
Design Goal: Refined Components
Design Goal: I focused on developing nested components to refine my prototype. By creating well considered components, I reduced all unnecessary screens for this prototype.
The early prototype focused on providing users the opportunity to locate an overview of student engagement data, view the details of top materials used by students, read data summaries, and filter by week or data type.
5.
Test
Usability Testing

I created a moderated user test to assess the key task outlined in the user flow. The usability plan outlined success metrics, a script for assessing tasks, and follow-up questions to capture a synthesis of the results.
The Objectives:
The level of intuitiveness as users navigate the analytics app
The ease of which users can access data and its interpretations
The quality and usability of the data visualizations.
The Task:
The user analyzes engagement of the materials posted to Google Classroom by week and then by month.
The success metrics:
Error Rate: Note the number of mistakes or missteps taken during each task
User Satisfaction: Ask participants to rate their satisfaction with each feature (1-5 scale) after completing each task.
Predictability: Ask participants if the features functioned in a predictable manner that felt intuitive to use.
The Results

Positive Feedback
Users rated the task as easy to accomplish, generally at a five.
Users found the data visualizations pertinent to their teaching practices.
The UI and visual layout received positive reactions because it simulated Google Classroom and felt familiar to users.
The prototype's ability to provide detailed engagement metrics, such as assignment completion percentages and resource usage, was praised.
The tool was seen as valuable for both teachers and parents to track student progress and resource utilization effectively.
Opportunities for Growth
The ability to navigate back from analytic pages can be improved to increase flexibility and support the users’ flow through analytic screens and tasks.
There was a unanimous recommendation for clearer labels that align with language used in education, specifically in the following areas:
Filter option “observations” should be changed to “progress”
“AI Overview” should be changed to “Data Summary” or “Data Overview” or “<Engagement> Data Overview”
As anticipated, users called for student-specific engagement data. This is an important feature, but was determined as an out-of-scope item for this add-a-feature project sprint.

6.
Implement
Prototype V.2
The prototype incorporated the growth opportunities identified during usability testing, significantly enhancing the user experience. Most notably, the navigation was refined to balance focused flows with an ability to traverse data types with ease.
The navigation back to previous screens was implemented as breadcrumbs. This style derived from Google Drives’ breadcrumb design. This navigational pattern helps users stay grounded in the current screen, with ease to travel back in the flow. The implementation of breadcrumbs was key in designing for scalability as the analytics tab and data visualizations grow in complexity.
The language on important labels was updated to align with terminology regularly used by educators. These terms were taken from the user research and usability testing.
Filter for Data Type: “Observations” became “Progress”
Gemini AI Label: “AI Overview” became “Data Summary”
*
Reflection
Project Goals
I set out to add a feature to Google Classroom that would expand educators’ ability to capture meaningful student data. In turn, this will support educators in refining their teaching approaches and materials to benefit students.
Expand on Google Classroom with a feature, while working within Google’s established design system.
Design a feature with one key interaction. The goal was to design with a refined prototype by creating nested components that can be effectively scaled and reused.
Introspective Outcomes
I really enjoyed working within an established design system. This type of structure helped me to really focus on the user research and subsequent ux which manifested as an analytics dashboard. The creativity that emerges amongst constraints never fails to amaze me.
The creation of a Project Scope visual is a key asset in tandem to a feature priority matrix. These two deliverables guide and ground the work as an achievable sprint that is deeply considered.
Future Focused
My next phase would be to conduct another round of user interviews to focus on the three categories of data (engagement, performance, and progress) and continue to refine the data visuals in alignment with educators’ needs
I would love to conduct A/B testing on the hierarchy of data visualizations and the Data Summary section
I would like to animate graphs and prototype various hover states to increase the interactivity of the data visualization cards.